The 5 principles of cloud service management and operations
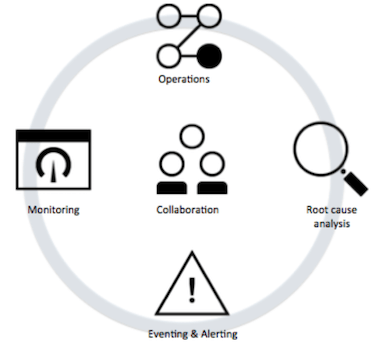
To adopt microservices-based applications and consider the service management and operational facets of their applications, your operations team can follow five principles:
- Operations
- Monitoring
- Eventing and alerting
- Collaboration
- Root-cause analysis
Managing microservices involves five key principles
Many companies are transforming their monolithic applications to use a microservices-based architecture. The microservices architecture provides many advantages:
Agility and speed in releasing new functionality Flexibility in changing the implementation Independence between functional units Scalability However, in terms of management, these benefits come with a price. The services management solution must deal with the microservices architecture’s inherent dynamics, dependencies, and complexities to ensure that the application is available and performing. Unless the operations management team is also shifting its paradigm, the microservices-based application might behave worse than a monolithic application that was built in the traditional fashion.
5 key principles of cloud service management and operations
In the Garage Method for Cloud, the Operate practices explain how to ensure operational excellence. You follow the Operate practices to deliver a more resilient environment:
Implicit redundancy through application high-availability and scalability
Fault tolerance by using concepts such as circuit breaker patterns
While these practices reduce the direct impact of an outage, they don’t relieve the DevOps team from detecting the incident and responding to it with a sense of urgency.
Managing microservices involves five key principles. The principles assist the operations team to adopt microservices-based applications. They also help developers think about the operational facets of their application, as both developers and operations share a common goal of services that are robust and of high quality. For this to happen it is important to engage Operations (or SREs) early to consider operational choices when designing and developing the application. Refactoring these decisions at a later time is error-prone, cumbersome and certainly less effective.
Operations
 Several operational activities typically must be done in a production environment: making sure that applications have the right capacity to cope with the load, complying with corporate or governmental policies, and so forth.
Some principles of these tasks are easier to achieve with the right support in place. In capacity management, for example, microservices can support elasticity where infrastructures can automatically scale depending on the usage. The 12-factor app manifesto describes a methodology for building applications that can scale without significant changes to tooling, architecture, or development practices.
While microservices don’t need to be implemented by using containers, it’s beneficial to use both technologies together. When you use containers, everything that is required for the software to run is packaged into isolated, lightweight bundles, making deployment and operations easier. Kubernetes is an open-source system for automating the deployment, scaling, and management of containerized applications. Kubernetes provides functionality for many operational tasks:
Placement of workload based on resource requirements Automated rollouts and rollbacks Service discovery and load balancing Horizontal scaling Self-healing As you can see, many of the typical operational tasks can be done through Kubernetes so that you can focus on other operational activities.
One of those tasks is checking compliance. For example, you might need to check for compliance with security advisories, corporate policies, or standards that are enforced by industry or government. These checks should already be run during the development and testing stages. It’s also wise to run the checks in production because many policies keep changing; for example, due to a security exposure becoming public.
Another example is backup and archiving. To protect from disasters and meet regulatory needs, backups must be done regularly based on RPO (recovery point objective), which is the maximum targeted period in which data might be lost, and RTO (recovery time objective), which is the targeted duration of time and a service level within which a business process must be restored after a disaster. A good microservices design externalizes storage-related activities to explicit persistency services so that these tasks can be limited to the services that deal with persistence. Needless to say, you must verify that the backups are consistent and usable.
Monitoring

Each microservice must be monitored. Before thinking of, let alone implementing, a monitoring solution, be sure to define what to monitor. Your guiding principle is the experience of the user of the service, which might be a human (for front-facing services) or a system (for back-end services). Therefore, the key metrics typically are availability, performance/response time/latency, and error rate. Ideally, synthetic transactions are done from multiple locations to ensure that the relevant functions of each service are “exercised” and that the key metrics are evaluated against expected results.
The metrics are drastically different from a typical monitoring solution that looks for CPU, memory, and disk space. Those parameters might still be monitored, but with the move toward cloud-based operating models such as IaaS and PaaS, the involvement of the application owner decreases.
Expose a HealthCheck API for each microservice. As developers know best what the critical resources and checks for their services are, they should implement HealthCheck.
Prometheus is an open-source monitoring framework and Fluentd is a logging data collector. Both tools work with Kubernetes. They provide some level of HealthCheck API natively, easing the path for developers to take advantage of it.
Another important element to monitor is application logs, as they provide visibility into the behavior of a running app. A typical use case is the parsing and investigation of logs during the diagnostic analysis of an incident. Critical alerts might be exposed in logs as well, so a monitoring solution should look for those patterns and alert the operations team. Most of the time, the logs are streams, such as 12-factor app processes that write their unbuffered event stream to stdout. Although microservices are loosely coupled, they depend on each other to provide their logic. They have been developed in different programming languages and their execution characteristics are distributed and highly dynamic, so procedures must be in place to aggregate logs to a central place and perform search and analysis from there.
One technique to stitch traces together is the use of correlation identifiers. Using correlation IDs not only helps to identify the execution path for a given transaction, but also supports visualization that adds the context of time, such as latency; the hierarchy of the services that are involved; and the serial or parallel nature of the process or task execution. OpenTracing is a vendor-neutral open standard for distributed tracing.
Eventing and alerting

The monitoring solution detects problems with the services, but plenty of alerts can still occur. In this meshed architecture, services depend on each other, so a degraded performance in one service might result in cascading failures in each of the dependent services. To avoid chasing symptoms rather than causes, an event-management system integrates alerts from various feeds—service monitoring, log monitoring, infrastructure monitoring—and attempts to correlate those events. To do so, topology information and deployment state information, such as how many instances of a service are currently running, are required.
As this information changes rapidly, the data must be gathered at the time of the correlation. Traditional approaches like Configuration Management Databases (CMDBs) have a high risk of showing incomplete or stale information. This dynamic data—for example, topology information—must be retrieved directly from the (container) management system at the time of the detection and used for correlation.
The results of this correlation are actionable alerts. Each event should be associated with a runbook so that the First Responder team knows how to respond to the alert and what mitigation action to do. Ideally, these runbooks are codified in the form of scripts so that the event-management system can automate the execution and surface only unique problems to a human.
Of course, you don’t want First Responders to waste time staring at consoles, so the system instead notifies them at the receipt of a new alert. Notifications can be sent through various channels: email, SMS text message, or an alert in an instant messaging system. The notification system also alerts other people if the response is not acknowledged by First Responders within a defined SLA.
Collaboration

After the First Responder is notified about the incident, he or she starts with the diagnostics. The first step is to isolate the component at fault. After it is isolated, the investigation continues to see what exactly happened and what can be done to restore the service as quickly as possible.
In an architecture where many services depend on each other, it’s likely that many people need to collaborate. As one of the key concepts of microservices is to support multi-language and event multi-platforms, the need to interact with subject matter experts (SMEs), including developers, is only increasing. The term ChatOps describes this process, where people use an instant-messaging communication platform to collaborate among SMEs. Through the ChatOps platform, all interaction is logged in a central place and you can browse through the log to see what actions were taken.
ChatOps is not limited to humans interacting with each other. By using bot technology, DevOps and service management tools can be integrated. Two examples are a monitoring system that pushes a chart showing the response-time distribution over the last 24 hours and a deployment system that informs ChatOps about the recent deployment tasks.
In addition, improved visibility through dashboards can expedite restoration. As the microservices-based application is dynamic in nature—continued deployment, auto scaling, dynamic instantiation, circuit-breakers, and so forth—having an accurate understanding of the application is a challenge. Dashboards visualize topology, deployment activities, and the operational state, showing availability and performance metrics. A dashboard should also visualize the key service indicators from a user perspective.
Root-cause analysis
Through collaboration, the operations team eventually identifies the correct mitigation and restores the service. To prevent the incident from reappearing, the root cause must be assessed. Follow the 5-Whys approach, as this method helps to surface the issue that was ultimately responsible for an incident. This investigation must be operated in a blameless culture; only through that approach are people willing to share their insights and help others to learn from the experience.
After the root-cause is known, appropriate steps are taken to address it. The steps might range from changes to the application or its architecture, changes to the infrastructure, or changes to the management system. Following an agile approach, these changes are put into the backlog and are ranked at the next sprint.
A continual challenge is that functional enhancements tend to be ranked higher than the outage-related changes. For those changes to be implemented, companies take different approaches. Some companies make operations the responsibility of the DevOps teams. In this model, developers have an intrinsic interest in addressing the reliability issues. Another approach is to establish a Site Reliability Engineering (SRE) team. This team is empowered to address reliability issues by spending at least 50% of their time on engineering work. Examples are reducing toil through automation and assisting the development team in implementing outage-related changes.